
INP Optimization: A Practical Guide to Interaction Readiness
Interaction to Next Paint decides whether your site feels instant or sluggish the moment a visitor taps, clicks, or types. This guide walks through how INP is scored, where interaction latency actually hides, and a measurement-first workflow to bring your slowest interactions under 200 milliseconds.
- INP measures the slowest meaningful interaction on a page across its whole lifecycle — not just the first input — so one heavy click handler can fail an otherwise fast site.
- Google buckets INP at ≤200ms (good), 200–500ms (needs improvement), and >500ms (poor), scored at the 75th percentile of real Chrome users.
- Most INP failures come from long tasks on the main thread: oversized JavaScript bundles, synchronous state updates, and third-party scripts competing for the same thread.
- Field data (CrUX, RUM) tells you which interactions fail for real users; lab tools only reproduce them. Fix in that order, not the reverse.
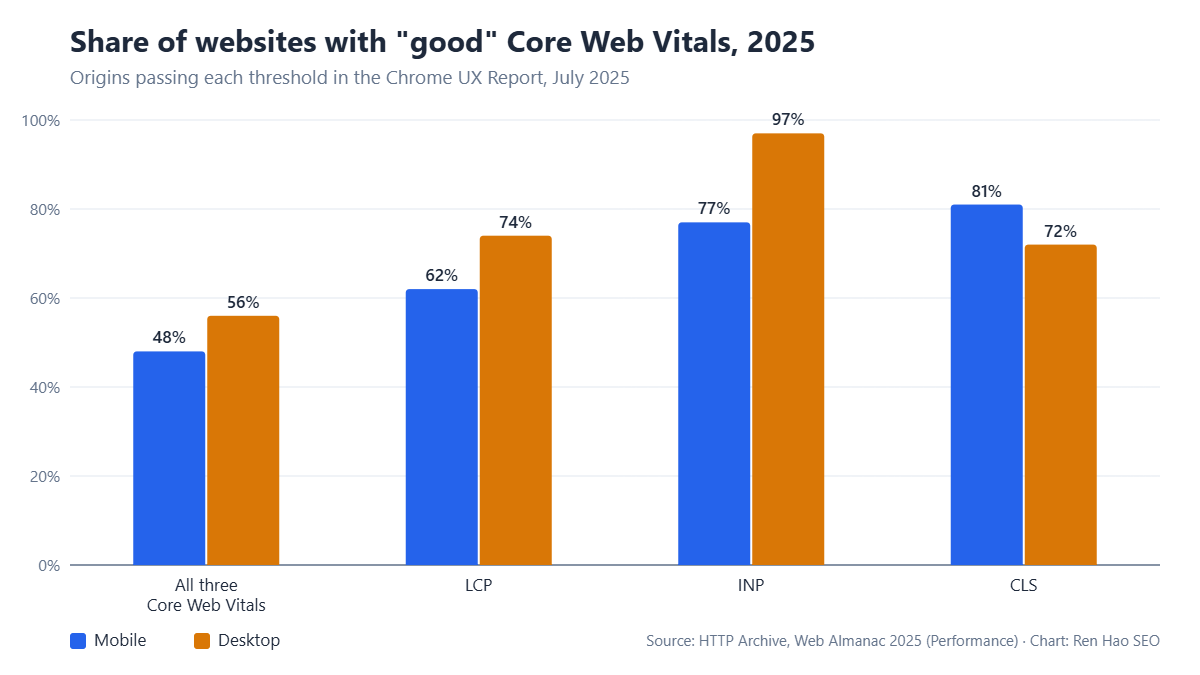
- INP sits inside the same page experience picture as LCP and CLS — and slow interaction readiness quietly suppresses conversions even where rankings hold.
What INP actually measures — and why FID kept flattering you
Interaction to Next Paint records the time from a user interaction — a click, a tap, a keypress — to the next frame the browser paints in response. It then reports the slowest meaningful interaction the page produced (with some outlier trimming on long sessions). That single definition explains why sites that comfortably passed First Input Delay started failing the moment INP replaced it as the responsiveness Core Web Vital: FID only measured the input delay of the first interaction, while INP watches every interaction for the entire life of the page and includes processing time and rendering delay, not just queueing.
This connects directly to On-Page SEO: The Complete Step-by-Step Guide (2026), which is worth reading next.
In our audit data across client sites, the pattern is consistent: pages pass FID with scores under 50ms while carrying INP readings of 350ms or worse, almost always on interactions that happen after load — opening a filter panel, adding to cart, expanding an accordion. The metric moved the goalposts from “did the page respond once, early” to “is the page ready to respond, always.” That is a much more honest description of how a site feels to use.
How the score is bucketed and where the thresholds bite
Google classifies INP at or under 200 milliseconds as good, between 200 and 500 milliseconds as needs improvement, and above 500 milliseconds as poor — assessed at the 75th percentile of real-user page loads in the Chrome User Experience Report. The percentile matters more than teams expect: your median user can have a perfectly fluid experience while the 75th percentile — older Android hardware, busy tabs, throttled CPUs — drags the reported score into the failing bucket.
This is why device mix is a segmentation you cannot skip. A B2B SaaS audience on modern laptops behaves nothing like a consumer retail audience where half of sessions arrive on mid-range mobile hardware. Before touching code, split your field data by device class and country; we routinely find a single market or device segment responsible for the entire failing score, which changes the fix from “rewrite the app” to “defer one script for one template.” Google’s own documentation on Interaction to Next Paint at web.dev is the canonical reference for the scoring model and is worth reading in full before you commit engineering time.
The anatomy of a slow interaction: input delay, processing, presentation
Every interaction breaks into three phases, and each fails for different reasons. Input delay is the wait before your event handler even starts — almost always caused by long tasks already occupying the main thread when the user interacts. Processing duration is your handler code itself: synchronous loops, heavy state recalculation, oversized component re-renders. Presentation delay is the time to paint the next frame after handlers finish — inflated by large DOM updates, layout thrashing, and unbatched style changes.
Diagnosing which phase dominates changes the remedy entirely. Long input delays point at bundle size and third-party scripts; long processing points at your own handler logic; long presentation points at rendering work. The Long Animation Frames API and Chrome DevTools performance traces now attribute this breakdown per interaction, which removes the guesswork that made responsiveness work so unrewarding two years ago. Measure first; the phase tells you where the engineering budget goes.
Field data first: build the failing-interaction inventory
Start with data, not hunches. Pull CrUX for the origin and per-URL where available, then instrument real-user monitoring with the web-vitals JavaScript library so each INP entry reports the element that was interacted with. Within a week you have an inventory: which templates fail, which elements on those templates, on which devices, in which markets. That inventory — not a lab score — is the work queue.
We treat this the way we treat every Core Web Vitals engagement: rank failing interactions by sessions affected multiplied by revenue relevance of the template. An add-to-cart button at 600ms on your money pages outranks a footer accordion at 900ms on the careers page, every time. Lab tools — Lighthouse timespans, DevTools CPU throttling — then reproduce each inventoried interaction so engineers can see the trace, not argue about whether the problem exists.
The fixes that actually move INP, in the order to try them
Break up long tasks first. Any main-thread task over 50ms delays whatever interaction arrives during it, so chunk heavy work with scheduler.yield() or setTimeout batching and move genuinely heavy computation to web workers. Second, cut JavaScript that ships at all: code-split by route, drop dead dependencies, and lazy-load below-the-fold interactivity. In our experience this pairs naturally with the site speed work covered in how site speed affects rankings — the same bundle discipline serves both load and responsiveness.
Third, audit event handlers: debounce input listeners, avoid synchronous layout reads after writes, and in framework code, memoize so a single click does not re-render half the component tree. Fourth, contain rendering cost — content-visibility on off-screen sections, smaller DOM subtrees, CSS containment on widgets. Fifth, quarantine third parties: tag managers, chat widgets, and A/B testing scripts are the most common source of input delay we see, and facade-loading them recovers 100ms+ on mid-range mobile with zero product change.
Interaction readiness is a UX and revenue problem, not just a metric
A 500ms pause after a tap reads as a broken button; users tap again, fire duplicate events, and abandon flows. That behavioral cost shows up in analytics as rage clicks, form abandonment, and depressed add-to-cart rates long before it shows up in rankings. We covered the engagement mechanics in our guide to UX and engagement; INP is simply the first responsiveness metric that quantifies them in field data Google also sees.
That framing helps internally, too. Responsiveness projects compete for engineering time against features, and “improves a Google metric” loses that argument. “Our checkout button takes 600ms to acknowledge a tap on the devices 40% of paying customers use” wins it. Tie every fix to a template, a segment, and a business flow, and the roadmap defends itself.
A 90-day INP program that survives contact with a real backlog
Days 1–14: instrument RUM with element attribution, segment CrUX by device and market, and produce the failing-interaction inventory. Days 15–45: ship the low-risk wins — third-party facades, code-splitting the worst template, breaking the two longest tasks. Re-measure in field data, not just lab, and expect a 28-day CrUX window before the public score moves. Days 46–90: the structural work — handler refactors, rendering containment, and a performance budget wired into CI so regressions fail the build instead of arriving in next month’s field data.
The program only holds if ownership is explicit: one engineer owns the inventory, one number (75th-percentile INP on money templates) goes on the dashboard, and every release notes whether it moved. Sites that treat responsiveness as a one-off sprint drift back within two quarters; the ones that wire it into CI keep the score.
Where INP fits in your wider technical SEO picture
INP is one signal inside the page experience picture, alongside LCP and CLS, and none of them outrank relevance and quality. But they compound: the same JavaScript discipline that fixes INP usually improves LCP, and both remove friction from the conversion paths your rankings feed. Treat interaction readiness as table stakes for the templates where users act — product pages, checkouts, lead forms — and as monitoring everywhere else. And remember the stack beneath the JavaScript: server response and infrastructure choices set the floor your front-end work builds on, a dependency we unpacked in how hosting and server configuration shape Core Web Vitals. If you want the fix list built from your own field data rather than a generic checklist, our technical SEO service starts exactly there.