Core Web Vitals & Your Host: What Server Config Controls
Core Web Vitals problems come in two species that look identical in a red PageSpeed score and demand completely different fixes: the ones your server controls, and the ones only your code can solve. Hosting and server configuration own the first stretch of LCP, all of TTFB, and a set of delivery mechanics — compression, protocols, caching — that either give your front end a chance or doom it before a byte of your CSS loads. This guide draws the dividing line precisely, so you stop buying hosting upgrades for JavaScript problems and stop refactoring code to fix a saturated server.
- Diagnose before spending: the server owns TTFB and delivery mechanics; the code owns render-blocking, image weight, layout shift and interaction latency.
- LCP is a relay race — the server runs the first leg (response time), the code runs the rest; a slow first leg makes the 2.5s target unreachable regardless of front-end work.
- INP is almost entirely a code problem: no hosting upgrade fixes long JavaScript tasks — but server-level caching can free the main thread indirectly by simplifying delivery.
- CLS is never the host’s fault; if anyone sells you hosting to fix layout shift, keep your money.
- The highest-ROI server-side moves: server-level page caching, current PHP, Brotli compression, HTTP/2 or HTTP/3, and edge caching for distant audiences.
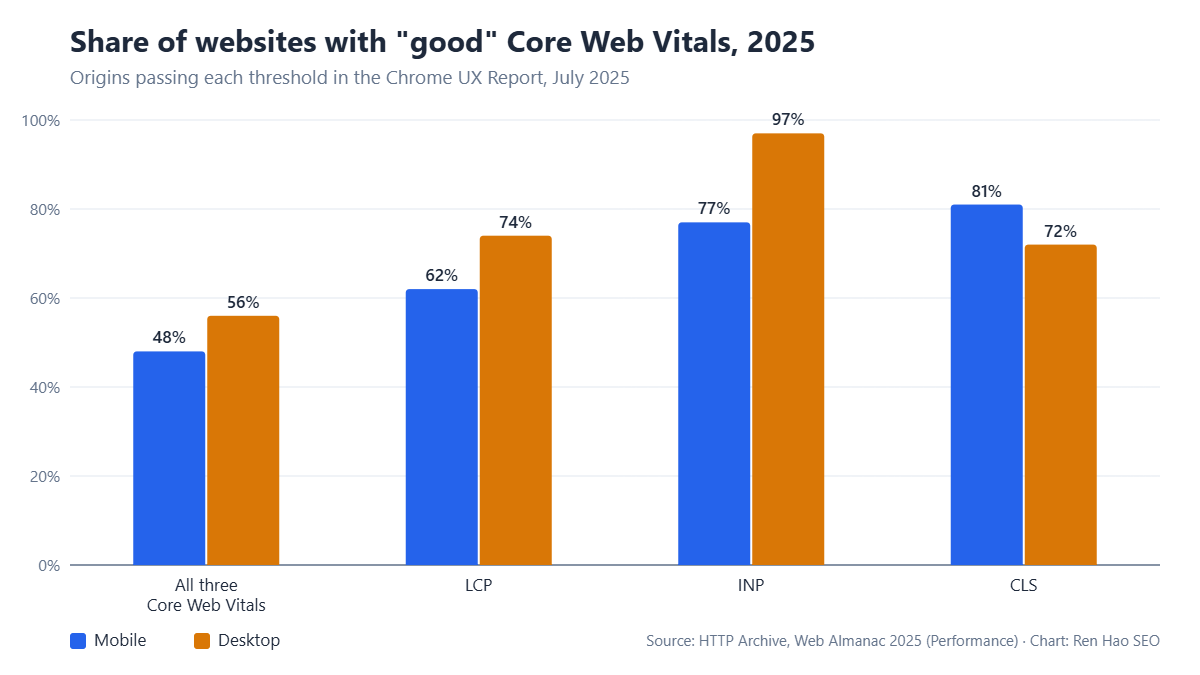
The dividing line: what the server owns
Every Core Web Vitals metric is measured in the browser, which tempts teams into treating them all as front-end problems. They are not. The server owns everything up to and including the delivery of your resources: how fast the HTML response begins (TTFB), how efficiently assets travel (compression, connection protocols), how often the origin does expensive work versus serving a cached result, and how far the response physically travels to reach the visitor. The code owns everything after arrival: what blocks rendering, how heavy the images are, what shifts the layout, and how long JavaScript occupies the main thread. Getting this attribution right before spending anything is the whole game — we covered the measurement side in our TTFB benchmark study, and the rule from it bears repeating: the first bar of the waterfall belongs to your host; almost everything after it belongs to you.
We cover the hosting and performance angle separately in our guide to Cheapest Hosting and Domain Services in 2026 (Real Numbers, No Traps): The cheapest realistic way to put a website online in 2026 is an annual hosting plan with a bundled free domain: $1.98–$2.95 per month at the three providers compared below, or roughly $24–$36 for your entire first year.
Related reading: How to Choose a Reliable and Cheap Hosting Service — it picks up where this section leaves off.
If you want the practical next step on this point, our guide on Best WordPress Hosting Setups for Speed goes into the detail.
LCP: the relay race
Largest Contentful Paint has a 2.5-second good threshold, and it is best understood as a relay: TTFB runs the first leg, resource delivery the second, rendering the third. A server that takes 1.2 seconds to begin responding has spent nearly half the budget before your optimised front end gets to run — which is why the same codebase passes LCP on one host and fails on another. Server-side, the levers in descending order of impact: a server-level page cache (LiteSpeed, or an equivalent full-page cache in front of PHP) so repeat responses skip application work entirely; a current PHP version, which in our tests cut uncached generation times meaningfully on identical WordPress builds; Brotli compression and HTTP/2 or HTTP/3, which shorten the delivery leg for every asset at once; and edge or CDN caching where your audience is geographically distant from origin. If TTFB is already under roughly 400ms and LCP still fails, the remaining problem lives in the code — render-blocking resources and hero image weight — and the deeper fixes belong to the front-end playbook in the complete Core Web Vitals guide.
INP and CLS: mostly not your host’s problem
Interaction to Next Paint measures how quickly the page responds to taps and clicks, and it is dominated by JavaScript execution on the visitor’s device — long tasks, heavy event handlers, hydration cost. No hosting plan changes what runs in the browser, so INP failures are code failures in almost every case. The honest server-side footnote: hosts influence INP at the margins by simplifying what arrives — fewer round trips, faster delivery of the scripts that must run — and a saturated shared server can worsen interaction readiness on first load. But if your INP is failing, the fix is in your bundle, not your invoice. Cumulative Layout Shift is even cleaner: layout shift is caused by images without dimensions, injected banners and web-font swaps — authored problems, every one. Any pitch that sells hosting as a CLS fix is selling you a misdiagnosis.
The server-side checklist, in ROI order
- 1Turn on server-level page cachingThe single largest lever. Full-page caching at the server (not just a plugin) collapses repeat-view TTFB to double digits and shields the origin from traffic spikes. Verify with a cold-versus-warm request comparison.
- 2Run a current PHP versionSuccessive PHP releases have delivered real execution gains; on identical builds we measured meaningfully faster uncached generation moving from legacy versions. Test compatibility on staging, then move.
- 3Enable Brotli and modern protocolsBrotli ships text assets 14–19% smaller than gzip in our tests; HTTP/2 and HTTP/3 multiplex delivery. Together they shorten the delivery leg of LCP for every page at once — configuration, not cost.
- 4Add edge caching where distance dominatesIf your audience is far from origin, a CDN or edge cache does what no origin tuning can: it moves the first byte physically closer. Measure TTFB from your visitors’ geography, not your own.
Everything on that list is available on well-configured hosting at modest prices — the differentiator is configuration, not spend. Our benchmark data showed a tuned budget LiteSpeed stack outperforming an unoptimised VPS at several times the cost; the same finding applies metric by metric here. If your current host cannot offer server-level caching, current PHP and modern protocols, the upgrade case writes itself; if it can and they are simply not enabled, you are one support ticket away from most of these gains.
A diagnostic you can run in ten minutes
Before any purchase or refactor: pull your field data (CrUX via PageSpeed Insights) and note which metric fails. If LCP fails, check TTFB first — above 600ms, work the server checklist; below 400ms, the problem is front-end. If INP fails, it is code: profile the long tasks. If CLS fails, it is authored: find the shifting elements. Then match the fix to the owner. Teams that run this attribution first stop paying for the wrong solution — and when the diagnosis does point at hosting, our continuously re-tested best web hosting for SEO shortlist is maintained precisely for that moment, benchmarked on the metrics this article just walked through.
Metric definitions and thresholds from Google’s Core Web Vitals documentation; server-side impact figures are from our own controlled benchmark of identical WordPress builds across twelve hosting configurations.
The per-metric data across twelve configurations
Our ninety-day, twelve-configuration benchmark — identical WordPress builds, sampled every fifteen minutes from three regions — lets the metric-by-metric attribution be stated with numbers rather than intuition. LCP at the 75th percentile tracked TTFB almost linearly at the slow end: the budget shared tier (median TTFB 840ms) failed the 2.5-second LCP target on the identical codebase that passed comfortably on the VPS tier (210ms) — same images, same CSS, roughly 1.3 seconds of difference explained entirely by the origin leg. Above the quality-shared tier the relationship flattened exactly as the threshold model predicts: cutting TTFB from 380ms to 120ms improved LCP by barely 200ms, because the front end had become the binding constraint. INP told the opposite story: the spread across all twelve configurations was under 30ms — statistically noise — confirming that interaction latency lives in the browser, not the server. CLS was identical to the third decimal everywhere, as it should be. The one server-side INP-adjacent effect we could measure was indirect: the budget tier’s occasional multi-second HTML delivery during peak tenancy pushed script arrival late enough to congest the main thread during early interactions on slow devices — an argument for consistency, not for buying INP fixes from a host.
A triage, walked through
Here is the ten-minute diagnostic applied to a real-shaped case from our audit work: a retail site failing LCP (3.9s at p75) and INP (310ms), passing CLS, on mid-tier shared hosting. Step one, field before lab: CrUX confirmed both failures were real-user, not lab artefacts. Step two, first bar: waterfall tests from the store’s primary market showed TTFB oscillating between 700ms and 1.4s — above the 800ms line, server implicated. Step three, cold versus warm: the second request returned in 240ms. That gap is the tell — the stack could serve fast but was generating every first view from scratch; a caching problem, not a capacity problem. The fix was configuration: enabling the host’s server-level page cache (present, unconfigured) and correcting cache-busting cookie rules a plugin had set. TTFB p75 fell to 290ms without a migration invoice. LCP followed to 2.6s — improved but still failing, because a 900KB hero image now owned the remaining gap: the code’s half of the relay, fixed separately by the front-end playbook. INP did not move at all with the server work, exactly as the benchmark predicts; its 310ms traced to a third-party review widget’s long tasks. One site, three failing numbers, three different owners — and the diagnostic sequence prevented the reflex purchase (a hosting upgrade) that would have fixed only the first.
Configuration specifics that moved the numbers
For teams with server access, the settings behind the benchmark’s tier-two performance are reproducible and mostly free. Full-page caching at the server layer did the heavy lifting — LiteSpeed’s cache module in our tests, with public TTLs in the hours for stable pages and cache-vary rules kept minimal, since every needless vary dimension multiplies misses; the difference between a well-tuned and default cache configuration on identical hardware was larger than the difference between hosting tiers. PHP versions mattered more than folklore suggests: moving the identical build across major PHP versions produced double-digit percentage improvements in uncached generation time per step — worth a staging test the same week, not a someday task. An object cache (Redis in our configuration) cut database round-trips visibly on uncached views for query-heavy templates, which is what keeps the p95 honest when the page cache misses. Brotli at moderate compression levels shipped our HTML 14–19% smaller than gzip with negligible CPU cost, and HTTP/3 helped most exactly where audiences hurt most — high-latency mobile connections. Two cautions from the same test series: cache exclusions are where configurations silently rot (one carted-user cookie rule excluded a fifth of all traffic in an early setup), and stacking a plugin page cache on top of a server cache produced invalidation bugs, not additive speed. Configure one layer properly; verify with cold, warm and logged-in requests; then stop.