
Information Gain: The Ranking Factor Behind Original Content
Google scores pages on what they add to the results already ranking. Here is how the June 2026 spam update applied that score, how to measure it before you publish, and the case data behind the method.
- Information gain scores a page on the information it adds relative to the pages already ranking for the query — it is separate from relevance.
- The June 2026 spam update removed visibility from accurate but redundant content; sites with a consistent first-party evidence layer held through it.
- Measure gain against the top ten before publishing: a draft under 20% novel-plus-extension should be merged, not published.
- Four durable sources of gain: first-party data, replicable method, a defensible position, and cross-source synthesis.
- A SaaS client grew organic traffic 320% with fewer pages by adding product-usage benchmarks and consolidating redundant guides.
What information gain means in ranking terms
Information gain is a score for how much a page adds to what a searcher could already learn from the pages ranking above it. Google described the mechanism in a 2020 patent application: after a user has seen a set of documents on a topic, a new document is scored on the additional information it contains relative to that set, and that score can be used to rank or re-rank results. In plain terms, a page that repeats the consensus earns a low information-gain score; a page that adds verified data, a tested method, or a perspective the others lack earns a high one.
This is a different question from relevance. Relevance asks whether a page answers the query. Information gain asks whether it answers the query differently from the ten pages that already do. Since 2024 the two have been pulling apart: Google’s own guidance on creating helpful, reliable, people-first content now asks directly whether content provides substantial value compared with other pages in results, and the spam policies added scaled content abuse as a violation. The June 2026 spam update applied those policies at volume, and the pattern we saw across affected sites was consistent: pages that were accurate, well-formatted and redundant lost visibility, while thinner pages with one original element held or gained.
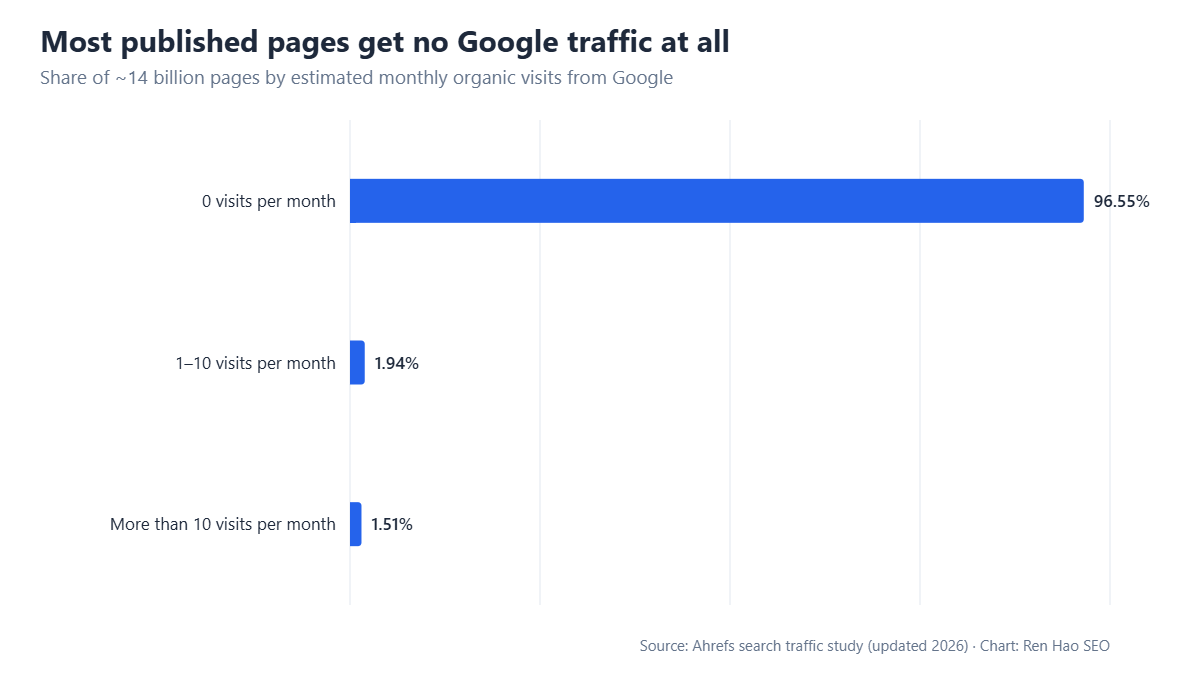
The chart above is the commercial context. Ahrefs’ index shows 96.55% of pages get no Google traffic at all. Most of them are not broken; they are duplicates of something that already ranks. Information gain is the ranking factor that separates the 3.45% from the rest, and it is the one factor that cannot be solved by better formatting.
Why the June 2026 spam update targeted redundant content
The June 2026 update went after content produced at scale without adding value, regardless of whether a human or a model produced it. Google’s scaled content abuse policy is explicit that the method does not matter; the test is whether many pages were generated primarily to manipulate rankings rather than to help users. In practice, the sites hit hardest shared three traits: hundreds of pages built from the same outline, no first-party evidence, and near-identical passages across pages with only the entity swapped.
Two mechanisms explain the losses. First, site-level quality tiering — the same system behind the May 2026 core update — evaluates a domain’s content as a body, so redundant pages drag down the tier for the pages that were original. Second, passage-level deduplication within a query set means the fifth page saying the same thing as the first four is not the fifth result; it is filtered before ranking. A page can be perfectly optimised on-page and still be invisible because it provides zero gain against the incumbents.
What did not get hit is equally instructive. Sites with fewer pages but a consistent first-party layer — customer data, test results, screenshots of real dashboards, methodology the reader could replicate — held their positions through both the May and June updates. That is the site-level signal: not that every page is a study, but that the domain’s default is to add something.
How to measure information gain before you publish
You measure information gain against the ranking set, not against your own site. Pull the top ten results for the target query, list every claim, number and sub-topic each one covers, and mark which of those your draft repeats. The share of your draft that appears nowhere in the top ten is your gain; if it is under 20% the page will struggle unless it has a link or brand advantage the incumbents lack.
We run that comparison in a spreadsheet rather than by feel, because the feel is usually wrong. Writers overestimate originality: a section that reads as fresh often turns out to be the fourth paraphrase of the same Google Search Central page. The process takes about forty minutes per article and has one hard output, a list of elements to add before the page is worth publishing.
- 1Extract the consensusList every H2, statistic, tool and recommendation across the top ten results. Group identical points. This is what the searcher can already learn.
- 2Score your draft line by lineMark each paragraph as consensus (repeats the set), extension (adds detail to a consensus point) or novel (absent from the set). Count words in each bucket.
- 3Find the gaps the set leaves openLook for questions the incumbents raise but do not answer, numbers they quote without a source, and sub-topics that appear in People Also Ask but in none of the ten pages.
- 4Add first-party evidence for at least one gapA data point from your own analytics, a test you ran, a client outcome with the method described. One verified original element outweighs three extension sections.
- 5Re-score and set the publish gateNovel plus extension should reach at least 35% of the body. Below that, either add evidence or merge the draft into an existing page rather than publishing a redundant one.
Four sources of gain that survive a spam update
Original data is the strongest source because it cannot be paraphrased away. When we published a 90-day TTFB benchmark across hosting plans, the numbers were cited by other sites and by AI answer engines for months, because no other page had them. First-party data does not need to be a large study; a table of what your own clients’ sites did after a change, with the sample size stated, is enough to be the only page on the query with evidence.
Method is the second source. Most guides describe what to do; few describe exactly how, with the order of operations and the failure cases. The step-by-step on-page SEO guide on this site keeps ranking against far larger domains because it specifies the sequence and the checks at each step, which the consensus pages leave out.
Perspective is the third: a defensible position that the ranking set does not hold. Arguing that most content audits should delete more than they refresh is a perspective; the reader can disagree, but it is not redundant. The fourth is synthesis across sources that never appear together — combining a Chrome UX Report finding with a Search Console pattern to explain a ranking loss, for example. Synthesis reads as original to both users and models because the connection itself is new.
- ✓First-party numbers with the sample and date statedAnalytics, test results, client outcomes, survey data — the one element that cannot be duplicated
- ✓A replicable method with failure casesSequence, tools, checks and the situations where the method does not work
- ✓A defensible positionA claim the ranking set does not make, with the reasoning shown
- ✓Cross-source synthesisTwo verified sources connected in a way the incumbents have not done
- ✓A named limitationWhat your evidence does not cover — a credibility signal that redundant pages never include
Case data: what original content did for a SaaS site after the updates
The clearest example in our client set is the SaaS program documented in the SaaS organic growth case study. The site had forty comparison and how-to pages that read well and ranked nowhere; the content audit scored them at 12% novel-plus-extension against their ranking sets. We did not add pages. We added a benchmark section to each comparison page built from the client’s own product usage data, rewrote the how-to pages around the support tickets the product team actually received, and consolidated eleven redundant pages into three.
Organic growth of 320% over the program came from fewer pages, and the timing matters: the gains held through the May 2026 core update and the June spam update while competitors running templated comparison libraries lost 30–60% of their non-brand traffic. The pages that grew most were the ones with a data table nobody else had. That is information gain expressed as revenue, and it is why our managed SEO programs now budget for evidence collection before drafting rather than after.
Rebuilding an existing content library for gain
Start with the pages that already rank between positions four and fifteen, because those are the ones where a gain increase changes outcomes fastest. Score each against its current ranking set. Pages below 20% gain go into one of three buckets: add evidence, merge into a stronger page, or remove. The content pruning and consolidation process covers the mechanics; the principle is that a redundant page costs more than it earns once site-level tiering is in play.
For the pages you keep, the highest-return edit is usually a single new section rather than a rewrite. Add the data table, the method with its failure cases, or the position, and update the title and introduction to lead with it. Then apply the content optimization fundamentals — headings that match how people phrase the sub-questions, direct answers at the top of each section, internal links to the cluster — so the added gain is legible to both crawlers and readers.
Track the result at the page level in Search Console for eight weeks. The signature of a successful gain edit is a rise in impressions for long-tail variants of the query before the head term moves, because the new section starts matching sub-queries the page never matched before. If impressions stay flat, the section was extension rather than novel; go back to the gap list.
The publish gate we use, and why it is strict
Every article on this site now passes a gate before scheduling: at least one first-party element, a novel-plus-extension share of 35% or more against the ranking set, and one named limitation. Articles that fail are merged or shelved, not published thinner. Since introducing the gate, the share of our own pages indexed within two weeks of publishing rose, which is the earliest signal that Google’s crawl systems treat the domain as a source of new information rather than a duplicate of the web.
The limitation of everything above is that it measures gain against today’s ranking set. Rankings move, and a page that was novel in March can be consensus by September as competitors copy it. The remedy is a refresh cycle tied to gain re-scoring rather than to a calendar, which is the last piece of the post-core-update quality audit we run for every managed client.
How AI answer engines reward the same signal
AI Overviews and answer engines select passages, not pages, and they select for the same property: a statement that adds something to the set they already hold. When we trace which of our pages get cited in AI Overviews, the cited passage is almost always a number with a stated source, a named limitation or a method step — never the definitional paragraph that every competitor also has. Redundant pages are not just outranked; they are never quoted.
That changes how a page should be written. The first forty to sixty words of each section should carry the novel element directly, in a form that can be lifted intact: a sentence with the figure, the sample and the date, or a rule with its exception. Consensus background can follow, but it should follow. Pages built this way earn two kinds of visibility from one edit — the classic ranking and the AI citation — and the cost is the same evidence collection the publish gate already requires.
Google Search Central: spam policies, including scaled content abuse and creating helpful, reliable, people-first content. Traffic distribution figure: Ahrefs search traffic study (chart above). Our own data: the SaaS program case study linked in this article; audit scores are from our 2026 client audits and are stated as observed ranges, not industry averages.